
Labs: your blood test results over time
Labs keeps your blood test results in one place, so you can see each marker across every draw instead of comparing PDFs from different years.
When to use it
After each blood test, when the results come in. It's also handy the week before a doctor's appointment, to see what has changed since last time.
How to use it
Add a draw's results
You type results in one marker at a time, one row per marker per draw.
- On Labs, click edit rows at the top (or Add results if you have none yet). This opens the results table.
- Click + Add.
- Fill in:
- Drawn: the date of the blood draw.
- Marker: for example LDL cholesterol or Vitamin D. Once you've typed a marker, it's suggested next time.
- Value and Unit.
-
As printed, only when the report shows something like
<0.2instead of a plain number. - Flag: H or L if the lab marked it high or low.
- Range low and Range high: the lab's reference range as numbers.
- Reference range (as printed): the range as the report writes it.
- Panel (for example Lipid panel), Lab and Notes if you like.
- Click Save, then + Add for the next marker.
To fix a result, click its row in the table, change it and Save, or Delete it.
Read the results
The switch at the top of Labs has four views.
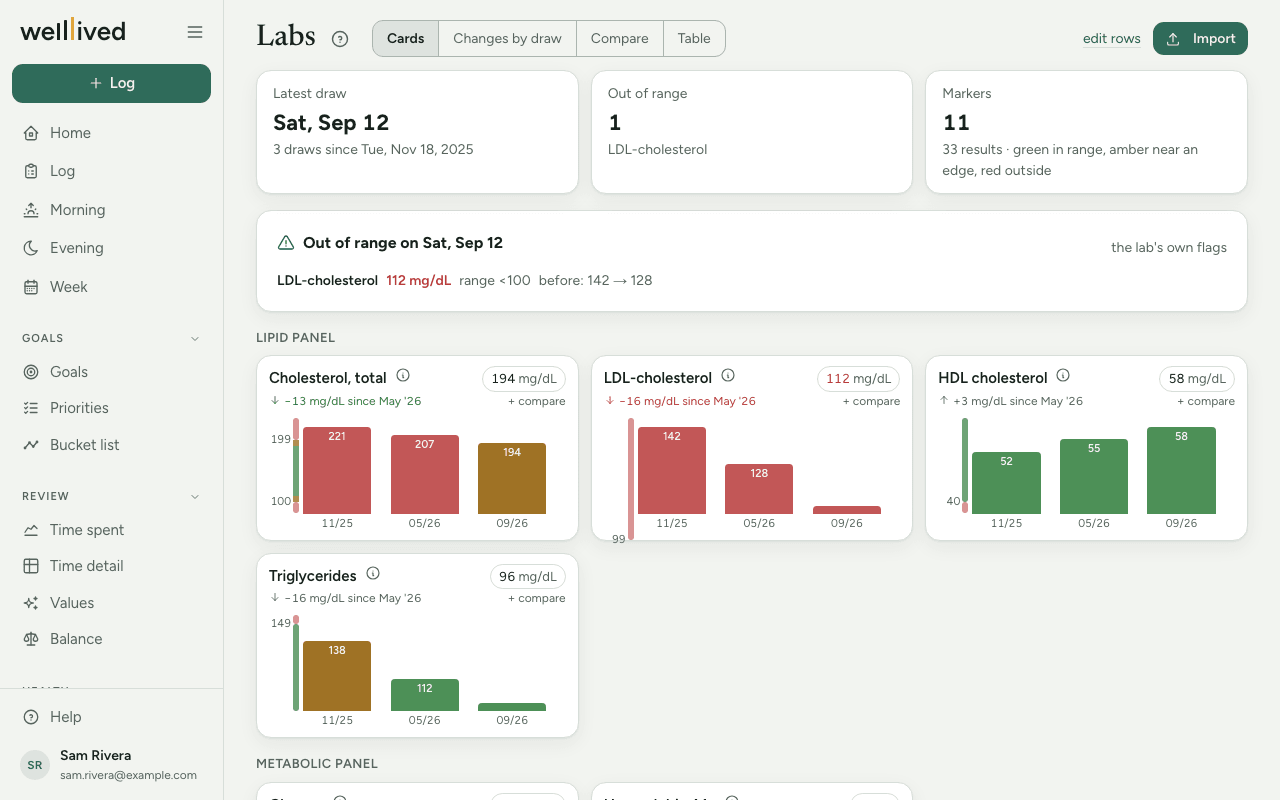
- Cards: one card per marker, grouped by panel. Each draw is a bar coloured by where it sat in that draw's reference range: green inside, amber inside but near an edge, red outside or flagged. The line under the name says how much it moved since the draw before. Tiles above show your latest draw, how many markers the lab flagged out of range, and how many markers you have. For common markers, the ⓘ explains what it measures and what high or low usually points to.
- Changes by draw: pick a draw, and every marker is ranked by how far it moved from the previous one, measured as a share of its reference range. That makes a cholesterol change and a vitamin change comparable, and shows what moved together.
- Compare: put up to eight markers on one chart. Each line shows where the marker sat inside its own range, with the in-range zone shaded. Tap marker names to add or remove them, or use + compare on a card.
- Table: every marker by every draw, numbers only, with the lab's flags in colour.
Tips
- Use exactly the same marker name every time. "LDL" and "LDL cholesterol" will show up as two different markers, so pick the suggestion when it appears.
- Fill in Range low and Range high. Without them, the bars can't be coloured by range, and Changes by draw and Compare have nothing fair to measure the marker against.
- The Out of range tile counts the lab's own H and L flags, so set Flag when the report has one.
- Entering markers in the order the report prints them keeps each panel together on the page.
- Each marker can have one result per date. To correct one, edit the existing row.
- The ⓘ notes are general reference, not medical advice. Your doctor's view of your results comes first.
Questions
Can I add results from a lab I've never used before? Yes. Ranges differ between labs, which is why each result keeps its own range and is coloured against it.
Why is a bar red when the lab didn't flag it? The value is outside the range you entered for that draw. Check the range low and high on that row.
What does "% of range" mean in Changes by draw? How far the marker moved, compared with the width of its normal range. A move of 25% or more is worth a look.
Why doesn't a marker have an ⓘ? The notes cover common markers under their usual names. A marker with a different name, or a less common one, won't have one.
How do I delete a whole draw? Delete each of its rows from the results table.
Related: Body, Health issues, Nutrition